The advent of high-throughput profiling methods (such as genomics or imaging) has accelerated basic research and made deep molecular characterization of patient samples routine.
These approaches provide a rich portrait of genes, molecular pathways, and cell types involved in disease phenotypes.
Machine learning (ML) can be a useful tool to extract disease-relevant patterns from high dimensional datasets.
However, depending on the complexity of the biological question, machine learning often requires many samples to identify recurrent and biologically meaningful patterns.
Rare diseases are inherently limited in clinical cases and thus have few samples to study.
In this perspective, we outline the challenges and emerging solutions for using ML for small sample sets, specifically that of rare diseases.
Advances in ML methods for rare diseases are likely to be informative for applications beyond rare diseases such as incorporating genomics into predictive modeling in precision medicine in which sample sizes are small but datasets are high-dimensional.
We propose that the methods community prioritizes the development of ML techniques for rare disease research.
Introduction
Rare disease researchers increasingly depend on machine learning (ML) to analyze high-dimensional datasets.
A systematic review of ML applications in rare diseases (as defined in the European Union, i.e. fewer than five patients per 10,000 people) uncovered 211 human studies that used ML to study 74 rare diseases over the last ten years.[1]
Indeed, ML can be a powerful tool in biomedical research but it does not come without pitfalls, some of which are magnified in a rare disease context.[2]
In this perspective, we discuss considerations for using two types of ML – supervised and unsupervised learning – in the study of rare diseases, with a specific focus on high-dimensional molecular data.
ML algorithms are computational methods that identify patterns in data, often in the form of lower-dimensional representations that can be used to perform useful computational tasks. Supervised learning algorithms must be trained with data in which samples are “labeled” with a trait of interest, such as a biological or clinical phenotype.
Supervised methods can learn correlations of features (e.g., expression measurements of a large number of genes) that may be associated with these labels to predict or infer these labels in unlabeled data, such as predicting which patients will or will not respond to treatment.
Therefore, if a study aims to classify patients with a rare disease into disease subtypes based on high-throughput molecular profiling, a supervised ML algorithm is appropriate to carry out this task.
Conversely, unsupervised learning algorithms learn patterns or features from unlabeled data.
In the absence of known disease subtypes, unsupervised ML approaches can be applied to gene expression data to identify groups of samples with similar patterns of molecular states or pathway activity. [3].
Unsupervised approaches can also extract combinations of features (e.g., genes) that may describe a certain cell type or pathway.
See Box 1 for more examples of how ML can be used in rare disease research.
While ML can be a useful tool, there are challenges in applying ML to rare disease datasets.
ML methods are generally most effective when using large datasets; analyzing high dimensional biomedical data such as gene expression with many thousands of features from rare disease datasets that typically contain relatively few samples is challenging[1,4].
Small sample datasets tend to lack statistical power and magnify the susceptibility of ML to misinterpretation and unstable performance.
With insufficient data, an unsupervised model will fail to identify patterns that are useful for biological discovery.
In the case of supervised models, they can be adversely impact if sample labels are uncertain or contain “label-noise”. [5]
Datasets with high label-noise decrease prediction accuracy and necessitate larger sample sizes during the process by which models learn patterns that distinguish samples in different classes [6] (model training; Box 2).
Rare disease datasets often come with significant label-noise.
For example, if classifications of rare disease subtypes evolve over time, researchers constructing datasets for ML research may find that cohorts collected at different time periods do not have comparable labels.
Additionally, a supervised ML model is of limited utility if it can only accurately predict sample labels in the data it was trained on, also known as overfitting.
Instead, most researchers aspire to develop models that generalize (maintain performance) when applied to new data that has not yet been “seen” by the model.
While we expect ML in rare disease research to continue to increase in popularity, the field requires methods that can learn patterns from small datasets and can generalize to newly acquired data [7].
In this perspective, we highlight approaches that address or better tolerate the limitations of rare disease data and discuss the future of ML applications in rare disease.
High-throughput ‘omic’ assays can generate thousands to billions of measurements from whole transcriptome and whole genome sequencing respectively, resulting in high-dimensional datasets.
A typical rare disease dataset consists of a small number of samples[1] leading to the “curse of dimensionality” in which the feature space is much larger than the sample space, increasing the difficulty in building highly generalizable models [8].
A larger feature space can contribute to higher data missingness (sparsity), more dissimilarity between samples (variance), and increased redundancy among individual features or combinations (multicollinearity) [9], all of which contribute to challenges in ML implementation.
An important factor in ML is model performance: the accuracy of a supervised model in identifying patterns relevant for a biological question, or the reliability of an unsupervised model in identifying hypothetical biological patterns supported by post-hoc validation.
When small sample sizes compromise an ML model’s performance, two approaches can be taken to manage sparsity, variance, and multicollinearity: 1) increase the number of samples, 2) improve the quality of samples.
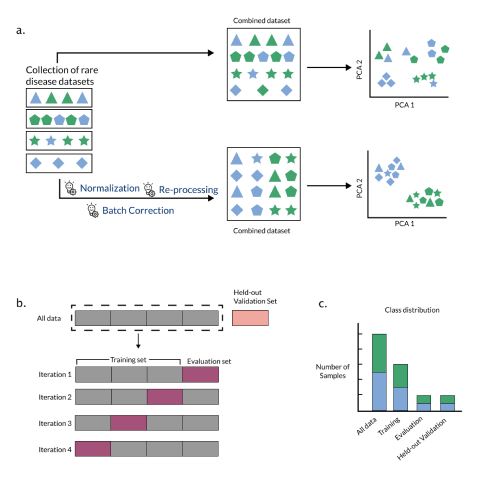
In the first approach, appropriate training, evaluation, and held-out validation sets could be constructed by combining multiple rare disease cohorts (Figure [1]a, Box 2).
When combining datasets, special attention should be directed towards data harmonization since data collection methods can differ between cohorts.
Without careful selection of aggregation methods, one may introduce technical – in contrast to biological – variability into the combined dataset and negatively impact the ML model’s ability to learn or detect meaningful signals.
Steps like reprocessing data using a single pipeline, using batch correction methods [10,11], and normalizing raw values appropriately without affecting the underlying variance in the data [12] may be necessary to mitigate unwanted variability. (Figure [1]a)
Data harmonization may also entail standardization of sample labels using biomedical ontologies to normalize how samples are described across multiple datasets.
How does one know if a composite dataset has undergone proper harmonization and annotation?
Ideally, the dominant patterns of the composite dataset reflect variables of interest, such as phenotype labels rather than technical labels.
In the latter case, this suggests that the datasets used to generate the composite dataset need to be corrected to overcome differences in how the data were generated or collected.
In the next section, we discuss approaches that help identify and visualize structure in datasets to determine whether composite rare disease datasets are appropriate for ML use.
Learning representations from rare disease data
Dimensionality reduction methods help explore and visualize underlying structure in the data (e.g., [15]), to define sample subgroups (e.g., [16]), or for feature selection and extraction during application of specific machine learning models [17] (Figure [2]c).
Unsupervised methods, in finding low-dimensional patterns in data, can ‘compress’ information from a large number of features into a smaller number of features [18,19,20] (Figure [2]).
A method commonly used for dimensionality reduction is principal components analysis (PCA).
PCA identifies higher order features, termed principal components (PCs), that are combinations of original features.
The PCs are calculated in a way that maximizes the amount of information (variance) they contain and ensures that each PC is uncorrelated with the other PCs. [19]
In practice, researchers often use the first few PCs to reduce the dimensionality without removing what may be important biological variability in the data.
Nguyen and Holmes highlight the use of “elbow method” to select the number of appropriate dimensions. [22]
Multidimensional scaling (MDS), t-distributed stochastic neighbor embedding (t-SNE), and uniform manifold approximation and projection (UMAP) are other popular dimension reduction methods, often used for low-dimensional visualization and interpretation of data [20,23]
Testing multiple dimensionality reduction methods may be necessary to obtain a more comprehensive portrait of the data. [24]
Other unsupervised learning approaches such as k-means or hierarchical clustering are used to characterize structure in genomic and imaging data. [25,26]
Dimensionality reduction methods are a subset of a type of ML called representation learning.
Representation learning methods have been used to extract features from transcriptomics datasets made of combinations of gene expression values [24,27,28], predict rare pathologies from images [29] (Box 1a) or detect cell populations associated with rare diseases [30].
When applied to complex systems, representation learning generally requires many samples and therefore may appear to aggravate the curse of dimensionality.
However, it can be a powerful tool to learn low-dimensional patterns from large datasets and then find those patterns in smaller, related datasets.
In later sections, we discuss this method of leveraging large datasets to reduce dimensionality in smaller datasets, also known as feature-representation-transfer learning.
Once the dimensions of the training dataset have been reduced, model training can proceed using the experimental design as outlined in Box 2.
Reducing misinterpretation of model output with statistical techniques
The successful application of ML can be improved by meeting certain conditions.
First, the dataset contains sufficient representation from each class such that relevant variability from that class is captured.
Second, the dataset is complete; all samples have measurements for all variables in the dataset (i.e., the dataset is not “sparse”, it is not missing data for some of the samples).
Third, there is no ambiguity about the labels for the samples in the dataset (i.e., no “label-noise”).
Rare disease datasets violate many of these assumptions.
Small number of samples for specific classes fail to fully capture the sample variability in those classes, e.g. only a few patients with a particular rare disease in a health records dataset, which can require special consideration for evaluation (Box 2).
The data are also often sparse, and there may be abundant label-noise due to incomplete understanding of the disease.
All of these contribute to low signal to noise ratio in rare disease datasets.
Applying ML to such data without addressing these shortcomings may lead to models that have poor generalizability or are hard to interpret.
Class imbalance in datasets can be addressed using decision tree-based ensemble learning methods (e.g., random forests). [31] (Figure[3]a)
Random forests use sampling with replacement based techniques to form a consensus about the important predictive features identified by the decision trees (e.g., Box 1c). [32,33]
Additional approaches like combining random forests with sampling without replacement can generate confidence intervals for the model predictions (for applications like Box 1d) by mimicking real world cases where most rare disease datasets are incomplete [34].
Resampling approaches are most helpful in constructing confidence intervals for algorithms that generate the same outcome every time they are run (i.e., deterministic models).
For decision trees that choose features at random for selecting a path to the outcome (i.e., are non-deterministic), resampling approaches can be helpful in estimating the reproducibility of the model.
When decision tree-based ensemble methods fail for rare disease datasets, cascade learning is a viable alternative. [35]
In cascade learning, multiple methods leveraging distinct statistical techniques are used to identify stable patterns in the dataset [???,36,37].
For example, a cascade learning approach for identifying rare disease patients from electronic health record data (Box 1a) incorporated independent steps for feature extraction (word2vec [38]), preliminary prediction with ensembled decision trees, and then prediction refinement using data similarity metrics. [35]
Combining these three methods resulted in better overall prediction when implemented on a silver standard dataset, as compared to a model that used ensemble-based prediction alone.
In addition to cascade learning, approaches that better represent rare classes using class re-balancing techniques like inverse sampling probability weighting [39], inverse class frequency weighting [40], oversampling of rare classes [41], or uniformly random undersampling of majority class [42] may also help minimize issues associated with class imbalance.
The presence of label-noise and sparsity in the data can lead to poor generalizability or overfitting, meaning that the models show high prediction accuracy on the training data but low prediction accuracy on new evaluation data.
Overfit models tend to rely on patterns that are unique to the training data, such as the clinical coding practices at a hospital, and not generalize to new data such as data collected at different hospitals. [43,44]
Regularization approaches can help mitigate these scenarios by adding constraints to a model to avoid making large prediction errors.
This protects ML models from poor generalizability by reducing model complexity and minimizing model feature space [45]. (Figure[3]a)
Examples of ML methods with regularization include ridge regression, LASSO regression, and elastic net regression [47], among others.
LASSO regularization helped select a few informative genes as features to include in models classifying amyotrophic lateral sclerosis (ALS) patients and healthy patients with high accuracy based on brain tissue gene expression, thus making the models more interpretable. [48]
In the context of rare immune cell signature discovery, where a few genes or features are expected to distinguish between immune cell types, elastic-net regression was able to exclude groups of uninformative genes by reducing their contribution to zero. [49]
In a study using a variational autoencoder (VAE) (see Box 3) for dimensionality reduction in gene expression data from acute myeloid leukemia (AML) samples, the KL loss between the input data and its low dimensional representation provided the regularizing penalty for the model. [51,52]
A study using a convolutional neural network (CNN) to identify tubers in MRI images from tuberous sclerosis patients (an application that can facilitate Box 1a), minimized overfitting using the dropout regularization method which removed randomly chosen network nodes in each iteration of the CNN model generating simpler models in each iteration.[53]
Thus, depending on the learning method used, regularization approaches should be considered when working with rare disease datasets.
Building upon prior knowledge and indirectly related data
One strategy to overcome the paucity of data in rare disease is to combine a variety of data types and explore rare disease data alongside other existing knowledge.
By using several data modalities, such as curated pathways, genetic data, or drug-target relationships, it may be possible to gain a better understanding of rare diseases.
Knowledge graphs (KGs) which integrate related-but-different data types, provide a rich multimodal data source e.g., Monarch Graph Database [54], hetionet [55], PheKnowLator [56], and the Global Network of Biomedical Relationships [57], Orphanet [58].
These graphs connect genetic, functional, chemical, clinical, and ontological data so that relationships of data with disease phenotypes can be explored through manual review [59] or computational methods [60,61]. (Figure[3]a)
KGs may include links (i.e. edges) or nodes that are specific to a rare disease of interest (e.g., an FDA approved treatment would be a specific disease-compound edge in the KG) and more generalized information (e.g., gene-gene interactions noted in the literature for a different disease). (Figure [4]a)
Rare disease researchers can repurpose general biological or chemical KGs that are not disease-specific to answer rare disease-based research questions [62] (e.g. Box 1b).
One tactic to sift through the large amounts of data encoded in KGs is to calculate the distances between nodes of interest (e.g., diseases and drugs for Box 1b [62]); often done by determining the “embeddings” - lower dimension vector representations of the position and connections of a particular point in the graph for nodes in the KG, and calculating the similarity between these embeddings.
Effective methods to calculate node embeddings that can generate actionable insights for rare diseases is an active area of research [62].
Another application of KGs is to augment a dataset [63].
Li et. al.[61] used a KG to identify linked terms in a medical corpus from a large number of patients, some with rare disease diagnoses.
They augmented their text dataset by mapping related clinical terms together - e.g., mapping “cancer” and “malignancy” in different patients to the same clinical concept.
With this enhanced dataset, they trained and tested a variety of text classification algorithms to identify rare disease patients within their corpus. (Figure [4]b, Box 1a)
Rare disease researchers have also integrated multiple KGs and applied neural network-based algorithms optimized for graph data, such as a graph convolutional neural networks.
Rao and colleagues [64] describe the construction of a KG using phenotype information from the Human Phenotype Ontology, and rare disease information from Orphanet and curated gene interaction/pathway data from Lit-BM-13 and WikiPathways [65,66,67].
They trained a spectral graph convolution neural network on this KG to identify and rank potentially causal genes for the rare diseases from Orphanet, and used this model to accurately predict causal genes for a ground truth dataset of rare diseases with known causal genes.
While several groups have used KGs to study rare diseases, we expect that better multi-modal datasets and ML methods to analyze KGs will make them a more popular and important tool in rare disease.
Another approach that builds on prior knowledge and large volumes of related data is transfer learning, a modeling technique that “borrows strength” across datasets with both similar and distinct properties like an imaging anomaly present in both rare and common diseases, to advance our understanding of rare diseases.
Transfer learning, where a model trained for one task or domain (source domain) is applied to another related task or domain (target domain), can be supervised or unsupervised.
Among various types of transfer learning, feature-representation-transfer approaches learn representations from the source domain and apply them to a target domain [68](Figure [5]a-c).
That is, representation learning, as discussed earlier, does not need to be applied only to describe the dataset on which the algorithm was trained – it can also be used to elucidate signals in sufficiently similar data (Figure [5]c) and may offer an improvement in descriptive capability over models trained only on small rare disease datasets (Fig [5]c).
For instance, low-dimensional representations can be learned from tumor transcriptomic data and transferred to describe patterns in genetic alterations in cell lines [24](Figure [5]c).
In the next section, we summarize specific instances of applying transfer learning, along with other techniques, to the study of rare diseases.
Combining approaches is required for the successful application of machine learning to rare diseases
We have described multiple approaches for maximizing the success of ML applications in rare disease, but it is rarely sufficient to use any of these techniques in isolation.
Below, we highlight two examples in the rare disease domain that use concepts of feature-representation-transfer, use of prior data, and regularization.
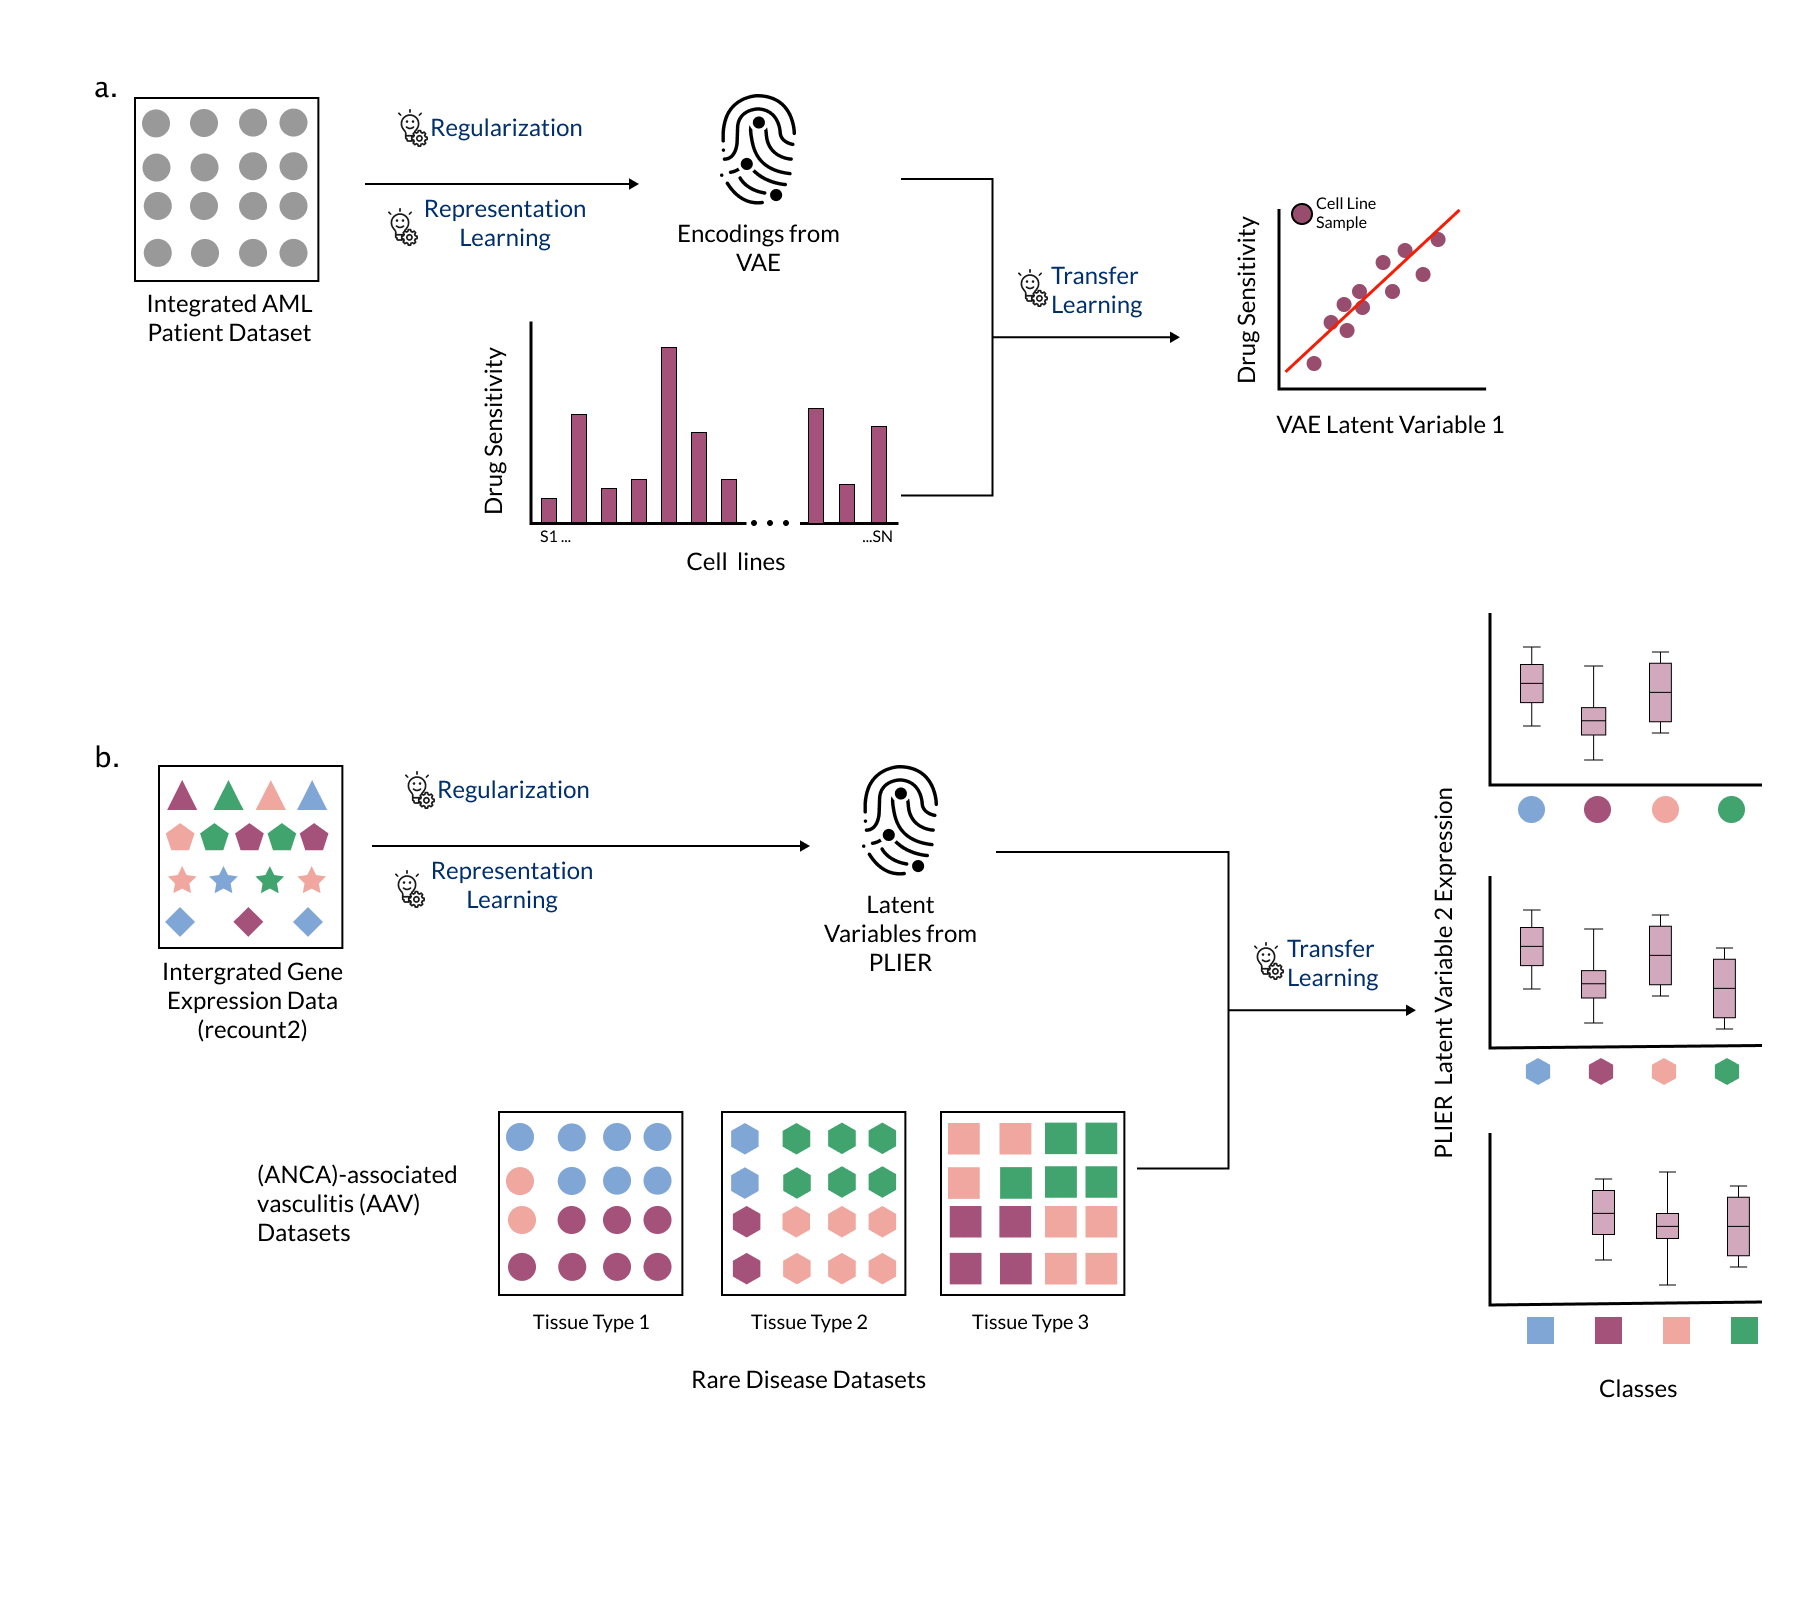
Our first example includes a large dataset of acute myeloid leukemia (AML) patient samples with no drug response data and a small in vitro experiment with drug response data [69].
Training an ML model on the small in vitro dataset alone faced the curse of dimensionality and the dataset size prohibited representation learning.
Dincer et al. trained a variational autoencoder (VAE, Box 3) on a reasonably large dataset of AML patient samples from 96 independent studies to learn meaningful representations in an approach termed DeepProfile [51] (Figure[6]a).
The representations or encodings learned by the VAE were then transferred to the small in vitro dataset reducing its number of features from thousands to eight, and improving the performance of the final LASSO linear regression model (Box 1b).
In addition to improving performance, the encodings learned by the VAE captured more biological pathways than PCA, possibly due to the constraints on the encodings imposed during training (Box 3).
Similar results were observed for prediction of histopathology in another rare cancer dataset [51].
While DeepProfile was centered on training on an individual disease and tissue combination, some rare diseases affect multiple tissues that a researcher may want to study (e.g., Box 1d).
Studying multiple tissues poses significant challenges and a cross-tissue analysis may require comparing representations from multiple models.
Models trained on a low number of samples may learn representations that “lump together” multiple biological signals, reducing the interpretability of the results.
To address these challenges, Taroni et al. trained a Pathway-Level Information ExtractoR (PLIER) (a matrix factorization approach that takes prior knowledge in the form of gene sets or pathways) [70] on a large generic collection of human transcriptomic data [71].
PLIER used constraints (regularization) that learned latent variables aligned with a small number of input gene sets, making it suitable for rare disease data.
The authors transferred the representations or latent variables learned by the model to describe transcriptomic data from the unseen rare diseases antineutrophil cytoplasmic antibody (ANCA)-associated vasculitis (AAV) and medulloblastoma in an approach termed MultiPLIER [71]. (Figure[6]b)
MultiPLIER used one model to describe multiple datasets instead of reconciling output from multiple models, making it possible to identify commonalities among disease manifestations or affected tissues.
DeepProfile [51] and MultiPLIER [71] exemplify modeling approaches incorporating prior knowledge – thereby constraining the model space according to plausible or expected biology – or sharing information across datasets.
These two methods capitalize on similar biological processes observed across different biological contexts and the fact that the methods underlying the approaches can effectively learn about those processes.
Outlook
This perspective highlights challenges in applying ML to rare disease data and approaches that address these challenges.
Small sample size, while significant, is not the only roadblock.
The high dimensionality of modern data requires creative approaches, such as learning new representations of the data, to manage the curse of dimensionality.
Leveraging prior knowledge and transfer learning methods to appropriately interpret data is also required.
Furthermore, we posit that researchers applying ML methods on rare disease data should use techniques that increase confidence (i.e., bootstrapping) and penalize complexity of the resultant models (i.e., regularization) to enhance the generalizability of their work.
It should be noted that the line between classical statistical methods and ML is fuzzy.
Multiple statistical techniques that were considered to be out of scope of this article (e.g. hierarchical models, Bayesian frameworks, association tests) [72,73,74,75], may have substantial potential to enhance the accuracy and generalizability of models, and should be considered in the rare disease study design process.
The approaches highlighted in this perspective come with challenges that may undermine investigators’ confidence in using these techniques for rare disease research.
We believe that the challenges in applying ML to rare disease are opportunities to improve data generation and method development going forward.
The following two areas are particularly important for the field to explore.
Intentional data generation and sharing mechanisms are key for powering the future of rare disease data analysis
While many techniques exist to collate rare data from different sources, low-quality data may hurt the end goal even if it increases the size of the dataset.
In our experience, collaboration with domain experts has proved to be critical in gaining insight into potential sources of variation in the datasets.
An anecdotal example: conversations with a clinician revealed that samples in a particular tumor dataset were collected using vastly different surgical techniques (laser ablation and excision vs standard excision).
This information, not readily available to non-experts, was obvious to the clinician.
Such instances suggest that collaboration with domain experts and sharing of well-annotated data is needed to generate robust datasets.
In addition to sample scarcity, comprehensive phenotypic-genotypic databases are also lacking.
While rare disease studies that collect genomic and phenotypic data are becoming more common [76,77,78], developing comprehensive genomics-based genotype-phenotype databases that prioritize clinical and genomics data standards is key to fueling interpretation of ML methods.
This method can be bolstered by funding or fostering collaboration between biobanking projects and patient registry initiatives.
Mindful sharing of data with proper metadata and attribution enabling prompt data reuse is important in building valuable datasets for rare disease research [79].
Finally, federated learning methods, such as those used in mobile health [80] and electronic healthcare records studies [81], may allow researchers to develop ML models on data from larger numbers of people with rare diseases whilst protecting patient privacy.
Methods that reliably support mechanistic interrogation of specific rare diseases are an unmet need
Most ML methods for rare diseases are used for classification tasks.
Not many methods investigate biological mechanisms; this is likely due to a lack of methods that can handle the limitations of rare disease data described throughout this perspective.
Developing methods to address this will be critical for applying ML to rare disease data.
For example, development of methods with a focus on explainability of the model can identify features that may be related to the underlying disease mechanism.[82]
Alternatively, representation learning or regularization methods may help identify multiple correlated features which can be interrogated to identify biologically meaningful pathways.
Additionally, robust error analysis for newly developed models to help users understand how a feature influences the performance of a model can provide insight into its potential contribution to the underlying disease mechanism. [83]
Interrogating disease mechanisms by adopting modifications of these approaches is necessary as ML applications become mainstream in research and clinical settings.
Finally, methods that can reliably integrate disparate datasets will likely always remain a need in rare disease research.
Methods that rely on finding structural correspondence between datasets (“anchors”) may be able to transform the status-quo of using ML in rare disease [84,85,86].
We speculate that this is an important and burgeoning area of research, and we are optimistic about the future of applying ML approaches to rare diseases.
Ethics Declaration
Justin Guinney is currently employed at Tempus Labs, a precision medicine company.
Jaclyn N. Taroni and Deepashree Venkatesh Prasad are employed with Alex’s Lemonade Stand Foundation, a research funder.
Author Contributions
Authorship was determined using ICMJE recommendations.
Conceptualization - J.B., J.N.T, R.J.A, C.S.G., J.G
Data curation - Not applicable
Formal Analysis - Not applicable
Funding acquisition - R.J.A,
Investigation - J.B., J.N.T, R.J.A;
Methodology - J.B., J.N.T, R.J.A.;
Project administration - J.B.
Resources - J.B., J.N.T, R.J.A;
Software - Not applicable
Supervision - J.B., C.S.G
Validation - Not applicable
Visualization - D.V.P
Writing – original draft - J.B., J.N.T., R.J.A.;
Writing – review & editing- J.B., J.N.T., R.J.A., C.S.G., J.G.
Funding
This work was supported in part by Alex’s Lemonade Stand Foundation, the National Human Genome Research Institute (R01 HG010067), the Eunice Kennedy Shriver National Institute of Child Health and Human Development (R01 HD109765), Neurofibromatosis Therapeutic Acceleration Program, and Children’s Tumor Foundation.
References
1. The use of machine learning in rare diseases: a scoping review
Julia Schaefer, Moritz Lehne, Josef Schepers, Fabian Prasser, Sylvia Thun Orphanet Journal of Rare Diseases (2020-12) https://doi.org/ghb3wx
DOI: 10.1186/s13023-020-01424-6 · PMID: 32517778 · PMCID: PMC7285453
2. Opportunities and Challenges for Machine Learning in Rare Diseases
Sergio Decherchi, Elena Pedrini, Marina Mordenti, Andrea Cavalli, Luca Sangiorgi Frontiers in Medicine (2021-10-05) https://doi.org/gpthzr
DOI: 10.3389/fmed.2021.747612 · PMID: 34676229 · PMCID: PMC8523988
3. Unsupervised Analysis of Transcriptomic Profiles Reveals Six Glioma Subtypes
Aiguo Li, Jennifer Walling, Susie Ahn, Yuri Kotliarov, Qin Su, Martha Quezado, J. Carl Oberholtzer, John Park, Jean C. Zenklusen, Howard A. Fine Cancer Research (2009-03-01) https://doi.org/d3kvzt
DOI: 10.1158/0008-5472.can-08-2100 · PMID: 19244127 · PMCID: PMC2845963
5. Learning statistical models of phenotypes using noisy labeled training data
Vibhu Agarwal, Tanya Podchiyska, Juan M Banda, Veena Goel, Tiffany I Leung, Evan P Minty, Timothy E Sweeney, Elsie Gyang, Nigam H Shah Journal of the American Medical Informatics Association (2016-11-01) https://doi.org/f9bxf9
DOI: 10.1093/jamia/ocw028 · PMID: 27174893 · PMCID: PMC5070523
6. Classification in the Presence of Label Noise: A Survey
Benoit Frenay, Michel Verleysen IEEE Transactions on Neural Networks and Learning Systems (2014-05) https://doi.org/f5zdgq
DOI: 10.1109/tnnls.2013.2292894 · PMID: 24808033
8. The properties of high-dimensional data spaces: implications for exploring gene and protein expression data
Robert Clarke, Habtom W. Ressom, Antai Wang, Jianhua Xuan, Minetta C. Liu, Edmund A. Gehan, Yue Wang Nature Reviews Cancer (2008-01) https://doi.org/ffksnf
DOI: 10.1038/nrc2294 · PMID: 18097463 · PMCID: PMC2238676
16. Dimensionality reduction by UMAP to visualize physical and genetic interactions
Michael W. Dorrity, Lauren M. Saunders, Christine Queitsch, Stanley Fields, Cole Trapnell Nature Communications (2020-03-24) https://doi.org/ggqcqp
DOI: 10.1038/s41467-020-15351-4 · PMID: 32210240 · PMCID: PMC7093466
19. Principal component analysis: a review and recent developments
Ian T. Jolliffe, Jorge Cadima Philosophical Transactions of the Royal Society A: Mathematical, Physical and Engineering Sciences (2016-04-13) https://doi.org/gcsfk7
DOI: 10.1098/rsta.2015.0202 · PMID: 26953178 · PMCID: PMC4792409
24. Compressing gene expression data using multiple latent space dimensionalities learns complementary biological representations
Gregory P. Way, Michael Zietz, Vincent Rubinetti, Daniel S. Himmelstein, Casey S. Greene Genome Biology (2020-12) https://doi.org/gg2mjh
DOI: 10.1186/s13059-020-02021-3 · PMID: 32393369 · PMCID: PMC7212571
25. Clustering cancer gene expression data: a comparative study
Marcilio Cp De Souto, Ivan G Costa, Daniel Sa De Araujo, Teresa B Ludermir, Alexander Schliep BMC Bioinformatics (2008-12) https://doi.org/dqqbn6
DOI: 10.1186/1471-2105-9-497 · PMID: 19038021 · PMCID: PMC2632677
26. Removing Batch Effects From Histopathological Images for Enhanced Cancer Diagnosis
Sonal Kothari, John H. Phan, Todd H. Stokes, Adeboye O. Osunkoya, Andrew N. Young, May D. Wang IEEE Journal of Biomedical and Health Informatics (2014-05) https://doi.org/gdm9jd
DOI: 10.1109/jbhi.2013.2276766 · PMID: 24808220 · PMCID: PMC5003052
27. Deriving disease modules from the compressed transcriptional space embedded in a deep autoencoder
Sanjiv K. Dwivedi, Andreas Tjärnberg, Jesper Tegnér, Mika Gustafsson Nature Communications (2020-02-12) https://doi.org/gg7krm
DOI: 10.1038/s41467-020-14666-6 · PMID: 32051402 · PMCID: PMC7016183
28. CoGAPS: an R/C++ package to identify patterns and biological process activity in transcriptomic data
Elana J. Fertig, Jie Ding, Alexander V. Favorov, Giovanni Parmigiani, Michael F. Ochs Bioinformatics (2010-11-01) https://doi.org/cwqsv4
DOI: 10.1093/bioinformatics/btq503 · PMID: 20810601 · PMCID: PMC3025742
29. Automatic detection of rare pathologies in fundus photographs using few-shot learning
Gwenolé Quellec, Mathieu Lamard, Pierre-Henri Conze, Pascale Massin, Béatrice Cochener Medical Image Analysis (2020-04) https://doi.org/ggsrc7
DOI: 10.1016/j.media.2020.101660 · PMID: 32028213
31. Enhancing techniques for learning decision trees from imbalanced data
Ikram Chaabane, Radhouane Guermazi, Mohamed Hammami Advances in Data Analysis and Classification (2020-09) https://doi.org/ghz4sz
DOI: 10.1007/s11634-019-00354-x
33. Evaluating predictive modeling algorithms to assess patient eligibility for clinical trials from routine data
Felix Köpcke, Dorota Lubgan, Rainer Fietkau, Axel Scholler, Carla Nau, Michael Stürzl, Roland Croner, Hans-Ulrich Prokosch, Dennis Toddenroth BMC Medical Informatics and Decision Making (2013-12) https://doi.org/f5jqvh
DOI: 10.1186/1472-6947-13-134 · PMID: 24321610 · PMCID: PMC4029400
34. Integrative Analysis Identifies Candidate Tumor Microenvironment and Intracellular Signaling Pathways that Define Tumor Heterogeneity in NF1
Jineta Banerjee, Robert J Allaway, Jaclyn N Taroni, Aaron Baker, Xiaochun Zhang, Chang In Moon, Christine A Pratilas, Jaishri O Blakeley, Justin Guinney, Angela Hirbe, … Sara Jc Gosline Genes (2020-02-21) https://doi.org/gg4rbj
DOI: 10.3390/genes11020226 · PMID: 32098059 · PMCID: PMC7073563
35. Learning to Identify Rare Disease Patients from Electronic Health Records
Rich Colbaugh, Kristin Glass, Christopher Rudolf, Mike Tremblay Volv Global Lausanne Switzerland AMIA … Annual Symposium proceedings. AMIA Symposium (2018-12-05) https://www.ncbi.nlm.nih.gov/pmc/articles/PMC6371307/
PMID: 30815073 · PMCID: PMC6371307
36. Component-based face detection
B. Heiselet, T. Serre, M. Pontil, T. Poggio Proceedings of the 2001 IEEE Computer Society Conference on Computer Vision and Pattern Recognition. CVPR 2001 (2001-12) https://doi.org/10.1109/CVPR.2001.990537
DOI: 10.1109/cvpr.2001.990537
38. Efficient Estimation of Word Representations in Vector Space
Tomas Mikolov, Kai Chen, Greg Corrado, Jeffrey Dean arXiv (2013-09-10) https://arxiv.org/abs/1301.3781
39. Improving random forest predictions in small datasets from two-phase sampling designs
Sunwoo Han, Brian D. Williamson, Youyi Fong BMC Medical Informatics and Decision Making (2021-12) https://doi.org/gp5pj6
DOI: 10.1186/s12911-021-01688-3 · PMID: 34809631 · PMCID: PMC8607560
40. A System for Classifying Disease Comorbidity Status from Medical Discharge Summaries Using Automated Hotspot and Negated Concept Detection
K. H. Ambert, A. M. Cohen Journal of the American Medical Informatics Association (2009-07-01) https://doi.org/dhg6jb
DOI: 10.1197/jamia.m3095 · PMID: 19390099 · PMCID: PMC2705265
45. Regularized Machine Learning in the Genetic Prediction of Complex Traits
Sebastian Okser, Tapio Pahikkala, Antti Airola, Tapio Salakoski, Samuli Ripatti, Tero Aittokallio PLoS Genetics (2014-11-13) https://doi.org/ghrqhq
DOI: 10.1371/journal.pgen.1004754 · PMID: 25393026 · PMCID: PMC4230844
46. Review and evaluation of penalised regression methods for risk prediction in low‐dimensional data with few events
Menelaos Pavlou, Gareth Ambler, Shaun Seaman, Maria De Iorio, Rumana Z Omar Statistics in Medicine (2016-03-30) https://doi.org/ggn9zg
DOI: 10.1002/sim.6782 · PMID: 26514699 · PMCID: PMC4982098
47. Regularization and variable selection via the elastic net
Hui Zou, Trevor Hastie Journal of the Royal Statistical Society: Series B (Statistical Methodology) (2005-04) https://doi.org/b8cwwr
DOI: 10.1111/j.1467-9868.2005.00503.x
48. Gene targeting in amyotrophic lateral sclerosis using causality-based feature selection and machine learning
Kyriaki Founta, Dimitra Dafou, Eirini Kanata, Theodoros Sklaviadis, Theodoros P. Zanos, Anastasios Gounaris, Konstantinos Xanthopoulos Molecular Medicine (2023-01-24) https://doi.org/grsmn6
DOI: 10.1186/s10020-023-00603-y · PMID: 36694130 · PMCID: PMC9872307
49. An elastic-net logistic regression approach to generate classifiers and gene signatures for types of immune cells and T helper cell subsets
Arezo Torang, Paraag Gupta, David J. Klinke BMC Bioinformatics (2019-12) https://doi.org/gg5hmj
DOI: 10.1186/s12859-019-2994-z · PMID: 31438843 · PMCID: PMC6704630
51. DeepProfile: Deep learning of cancer molecular profiles for precision medicine
Ayse Berceste Dincer, Safiye Celik, Naozumi Hiranuma, Su-In Lee Bioinformatics (2018-03-08) https://doi.org/gdj2j4
DOI: 10.1101/278739
53. Deep learning in rare disease. Detection of tubers in tuberous sclerosis complex
Iván Sánchez Fernández, Edward Yang, Paola Calvachi, Marta Amengual-Gual, Joyce Y. Wu, Darcy Krueger, Hope Northrup, Martina E. Bebin, Mustafa Sahin, Kun-Hsing Yu, … on behalf of the TACERN Study Group PLOS ONE (2020-04-29) https://doi.org/gpp5xt
DOI: 10.1371/journal.pone.0232376 · PMID: 32348367 · PMCID: PMC7190137
54. The Monarch Initiative: an integrative data and analytic platform connecting phenotypes to genotypes across species
Christopher J. Mungall, Julie A. McMurry, Sebastian Köhler, James P. Balhoff, Charles Borromeo, Matthew Brush, Seth Carbon, Tom Conlin, Nathan Dunn, Mark Engelstad, … Melissa A. Haendel Nucleic Acids Research (2017-01-04) https://doi.org/f9v7bz
DOI: 10.1093/nar/gkw1128 · PMID: 27899636 · PMCID: PMC5210586
55. Systematic integration of biomedical knowledge prioritizes drugs for repurposing
Daniel Scott Himmelstein, Antoine Lizee, Christine Hessler, Leo Brueggeman, Sabrina L Chen, Dexter Hadley, Ari Green, Pouya Khankhanian, Sergio E Baranzini eLife (2017-09-22) https://doi.org/cdfk
DOI: 10.7554/elife.26726 · PMID: 28936969 · PMCID: PMC5640425
56. A Framework for Automated Construction of Heterogeneous Large-Scale Biomedical Knowledge Graphs
Tiffany J. Callahan, Ignacio J. Tripodi, Lawrence E. Hunter, William A. Baumgartner Bioinformatics (2020-05-02) https://doi.org/gg338z
DOI: 10.1101/2020.04.30.071407
59. Structured reviews for data and knowledge-driven research
Núria Queralt-Rosinach, Gregory S Stupp, Tong Shu Li, Michael Mayers, Maureen E Hoatlin, Matthew Might, Benjamin M Good, Andrew I Su Database (2020-01-01) https://doi.org/ggsdkj
DOI: 10.1093/database/baaa015 · PMID: 32283553 · PMCID: PMC7153956
60. Learning Drug-Disease-Target Embedding (DDTE) from knowledge graphs to inform drug repurposing hypotheses
Changsung Moon, Chunming Jin, Xialan Dong, Saad Abrar, Weifan Zheng, Rada Y. Chirkova, Alexander Tropsha Journal of Biomedical Informatics (2021-07) https://doi.org/gmpgs6
DOI: 10.1016/j.jbi.2021.103838 · PMID: 34119691
61. Improving rare disease classification using imperfect knowledge graph
Xuedong Li, Yue Wang, Dongwu Wang, Walter Yuan, Dezhong Peng, Qiaozhu Mei BMC Medical Informatics and Decision Making (2019-12) https://doi.org/gg5j65
DOI: 10.1186/s12911-019-0938-1 · PMID: 31801534 · PMCID: PMC6894101
62. A Literature-Based Knowledge Graph Embedding Method for Identifying Drug Repurposing Opportunities in Rare Diseases
Daniel N. Sosa, Alexander Derry, Margaret Guo, Eric Wei, Connor Brinton, Russ B. Altman Biocomputing 2020 (2019-12) https://doi.org/gmpgs7
DOI: 10.1142/9789811215636_0041 · ISBN: 9789811215629
63. Rare disease knowledge enrichment through a data-driven approach
Feichen Shen, Yiqing Zhao, Liwei Wang, Majid Rastegar Mojarad, Yanshan Wang, Sijia Liu, Hongfang Liu BMC Medical Informatics and Decision Making (2019-12) https://doi.org/gm48cq
DOI: 10.1186/s12911-019-0752-9 · PMID: 30764825 · PMCID: PMC6376651
64. Phenotype-driven gene prioritization for rare diseases using graph convolution on heterogeneous networks
Aditya Rao, Saipradeep Vg, Thomas Joseph, Sujatha Kotte, Naveen Sivadasan, Rajgopal Srinivasan BMC Medical Genomics (2018-12) https://doi.org/gnb3q7
DOI: 10.1186/s12920-018-0372-8 · PMID: 29980210 · PMCID: PMC6035401
65. The Human Phenotype Ontology in 2021
Sebastian Köhler, Michael Gargano, Nicolas Matentzoglu, Leigh C Carmody, David Lewis-Smith, Nicole A Vasilevsky, Daniel Danis, Ganna Balagura, Gareth Baynam, Amy M Brower, … Peter N Robinson Nucleic acids research (2021-01-08) https://www.ncbi.nlm.nih.gov/pmc/articles/PMC7778952/
DOI: 10.1093/nar/gkaa1043 · PMID: 33264411 · PMCID: PMC7778952
66. A Proteome-Scale Map of the Human Interactome Network
Thomas Rolland, Murat Taşan, Benoit Charloteaux, Samuel J. Pevzner, Quan Zhong, Nidhi Sahni, Song Yi, Irma Lemmens, Celia Fontanillo, Roberto Mosca, … Marc Vidal Cell (2014-11) https://doi.org/f3mn6x
DOI: 10.1016/j.cell.2014.10.050 · PMID: 25416956 · PMCID: PMC4266588
67. WikiPathways: connecting communities
Marvin Martens, Ammar Ammar, Anders Riutta, Andra Waagmeester, Denise N Slenter, Kristina Hanspers, Ryan A. Miller, Daniela Digles, Elisson N Lopes, Friederike Ehrhart, … Martina Kutmon Nucleic Acids Research (2021-01-08) https://doi.org/gh6dq2
DOI: 10.1093/nar/gkaa1024 · PMID: 33211851 · PMCID: PMC7779061
68. A Survey on Transfer Learning
Sinno Jialin Pan, Qiang Yang IEEE Transactions on Knowledge and Data Engineering (2010-10) https://doi.org/bc4vws
DOI: 10.1109/tkde.2009.191
69. A machine learning approach to integrate big data for precision medicine in acute myeloid leukemia
Su-In Lee, Safiye Celik, Benjamin A. Logsdon, Scott M. Lundberg, Timothy J. Martins, Vivian G. Oehler, Elihu H. Estey, Chris P. Miller, Sylvia Chien, Jin Dai, … Pamela S. Becker Nature Communications (2018-01-03) https://doi.org/gcpx72
DOI: 10.1038/s41467-017-02465-5 · PMID: 29298978 · PMCID: PMC5752671
70. Pathway-level information extractor (PLIER) for gene expression data
Weiguang Mao, Elena Zaslavsky, Boris M. Hartmann, Stuart C. Sealfon, Maria Chikina Nature Methods (2019-07) https://doi.org/gf75g6
DOI: 10.1038/s41592-019-0456-1 · PMID: 31249421 · PMCID: PMC7262669
71. MultiPLIER: A Transfer Learning Framework for Transcriptomics Reveals Systemic Features of Rare Disease
Jaclyn N. Taroni, Peter C. Grayson, Qiwen Hu, Sean Eddy, Matthias Kretzler, Peter A. Merkel, Casey S. Greene Cell Systems (2019-05) https://doi.org/gf75g5
DOI: 10.1016/j.cels.2019.04.003 · PMID: 31121115 · PMCID: PMC6538307
72. Phenotype Similarity Regression for Identifying the Genetic Determinants of Rare Diseases
Daniel Greene, Sylvia Richardson, Ernest Turro The American Journal of Human Genetics (2016-03) https://doi.org/f8fqks
DOI: 10.1016/j.ajhg.2016.01.008 · PMID: 26924528 · PMCID: PMC4827100
73. Rare-Variant Association Testing for Sequencing Data with the Sequence Kernel Association Test
Michael C. Wu, Seunggeun Lee, Tianxi Cai, Yun Li, Michael Boehnke, Xihong Lin The American Journal of Human Genetics (2011-07) https://doi.org/bc6nrt
DOI: 10.1016/j.ajhg.2011.05.029 · PMID: 21737059 · PMCID: PMC3135811
74. Identification of Rare Causal Variants in Sequence-Based Studies: Methods and Applications to VPS13B, a Gene Involved in Cohen Syndrome and Autism
Iuliana Ionita-Laza, Marinela Capanu, Silvia De Rubeis, Kenneth McCallum, Joseph D. Buxbaum PLoS Genetics (2014-12-11) https://doi.org/f6vdbt
DOI: 10.1371/journal.pgen.1004729 · PMID: 25502226 · PMCID: PMC4263785
75. A Fast Association Test for Identifying Pathogenic Variants Involved in Rare Diseases
Daniel Greene, Sylvia Richardson, Ernest Turro The American Journal of Human Genetics (2017-07) https://doi.org/gbnhnj
DOI: 10.1016/j.ajhg.2017.05.015 · PMID: 28669401 · PMCID: PMC5501869
76. Rare-disease genetics in the era of next-generation sequencing: discovery to translation
Kym M. Boycott, Megan R. Vanstone, Dennis E. Bulman, Alex E. MacKenzie Nature Reviews Genetics (2013-10) https://doi.org/ghvhsd
DOI: 10.1038/nrg3555 · PMID: 23999272
77. Paediatric genomics: diagnosing rare disease in children
Caroline F. Wright, David R. FitzPatrick, Helen V. Firth Nature Reviews Genetics (2018-05) https://doi.org/gcxbr8
DOI: 10.1038/nrg.2017.116 · PMID: 29398702
78. Next-Generation Sequencing to Diagnose Suspected Genetic Disorders
David R. Adams, Christine M. Eng New England Journal of Medicine (2018-10-04) https://doi.org/gf49m7
DOI: 10.1056/nejmra1711801 · PMID: 30281996
80. The future of digital health with federated learning
Nicola Rieke, Jonny Hancox, Wenqi Li, Fausto Milletarì, Holger R. Roth, Shadi Albarqouni, Spyridon Bakas, Mathieu N. Galtier, Bennett A. Landman, Klaus Maier-Hein, … M. Jorge Cardoso npj Digital Medicine (2020-09-14) https://doi.org/ghmnwd
DOI: 10.1038/s41746-020-00323-1 · PMID: 33015372 · PMCID: PMC7490367
81. A Continuously Benchmarked and Crowdsourced Challenge for Rapid Development and Evaluation of Models to Predict COVID-19 Diagnosis and Hospitalization
Yao Yan, Thomas Schaffter, Timothy Bergquist, Thomas Yu, Justin Prosser, Zafer Aydin, Amhar Jabeer, Ivan Brugere, Jifan Gao, Guanhua Chen, … Jimmy Phuong JAMA Network Open (2021-10-11) https://doi.org/gpz2bw
DOI: 10.1001/jamanetworkopen.2021.24946 · PMID: 34633425 · PMCID: PMC8506231
82. Explainable machine-learning predictions for the prevention of hypoxaemia during surgery
Scott M. Lundberg, Bala Nair, Monica S. Vavilala, Mayumi Horibe, Michael J. Eisses, Trevor Adams, David E. Liston, Daniel King-Wai Low, Shu-Fang Newman, Jerry Kim, Su-In Lee Nature Biomedical Engineering (2018-10-10) https://doi.org/ggbrzv
DOI: 10.1038/s41551-018-0304-0 · PMID: 31001455 · PMCID: PMC6467492
84. Domain Adaptation with Structural Correspondence Learning
John Blitzer, Ryan McDonald, Fernando Pereira Proceedings of the 2006 Conference on Empirical Methods in Natural Language Processing (2006-07) https://aclanthology.org/W06-1615
85. Heterogeneous domain adaptation using manifold alignment
Chang Wang, Sridhar Mahadevan Proceedings of the Twenty-Second international joint conference on Artificial Intelligence - Volume Volume Two (2011-07-16) https://dl.acm.org/doi/10.5555/2283516.2283652
ISBN: 9781577355144
86. Comprehensive Integration of Single-Cell Data
Tim Stuart, Andrew Butler, Paul Hoffman, Christoph Hafemeister, Efthymia Papalexi, William M. Mauck, Yuhan Hao, Marlon Stoeckius, Peter Smibert, Rahul Satija Cell (2019-06) https://doi.org/gf3sxv
DOI: 10.1016/j.cell.2019.05.031 · PMID: 31178118 · PMCID: PMC6687398
87. Reproducible RNA-seq analysis using recount2
Leonardo Collado-Torres, Abhinav Nellore, Kai Kammers, Shannon E Ellis, Margaret A Taub, Kasper D Hansen, Andrew E Jaffe, Ben Langmead, Jeffrey T Leek Nature Biotechnology (2017-04) https://doi.org/gf75hp
DOI: 10.1038/nbt.3838 · PMID: 28398307 · PMCID: PMC6742427
89. The relationship between Precision-Recall and ROC curves
Jesse Davis, Mark Goadrich Proceedings of the 23rd international conference on Machine learning - ICML ’06 (2006) https://doi.org/fc8wzr
DOI: 10.1145/1143844.1143874 · ISBN: 9781595933836
91. A guide to machine learning for biologists
Joe G. Greener, Shaun M. Kandathil, Lewis Moffat, David T. Jones Nature Reviews Molecular Cell Biology (2022-01) https://doi.org/gmsvvn
DOI: 10.1038/s41580-021-00407-0 · PMID: 34518686
92. Deep Convolutional Neural Networks for Computer-Aided Detection: CNN Architectures, Dataset Characteristics and Transfer Learning
Hoo-Chang Shin, Holger R. Roth, Mingchen Gao, Le Lu, Ziyue Xu, Isabella Nogues, Jianhua Yao, Daniel Mollura, Ronald M. Summers IEEE Transactions on Medical Imaging (2016-05) https://doi.org/gcgmbg
DOI: 10.1109/tmi.2016.2528162 · PMID: 26886976 · PMCID: PMC4890616
Figure 1: Combining datasets to increase data for training machine learning models. a) Appropriate methods are required to combine smaller datasets into a larger composite dataset: The left panel shows multiple small, rare disease datasets that need to be combined to form a dataset of higher sample size. The color of the samples suggests classes or groups present in the datasets. The shape represents the dataset of origin. The middle panel shows methods that may be used to combine the datasets while accounting for dataset-specific technical differences. The right panel shows Principal Component Analysis of the combined datasets to verify proper integration of samples in the larger dataset. b) Composite datasets can be used to make training, evaluation, and validation datasets for machine learning: Left panel shows the division of the composite dataset into training dataset and a held-out validation dataset (top). The held-out validation set is a separate study that has not been seen by the model. The training set is further divided into training and evaluation datasets for k-fold cross-validation (in this example k=4), where each fold contains all samples from an individual study. This approach is termed study-wise cross validation and supports the goal of training models that generalize to unseen cohorts. c) Barplot showing the class distribution of the training, evaluation, and held-out validation datasets from panel (b).
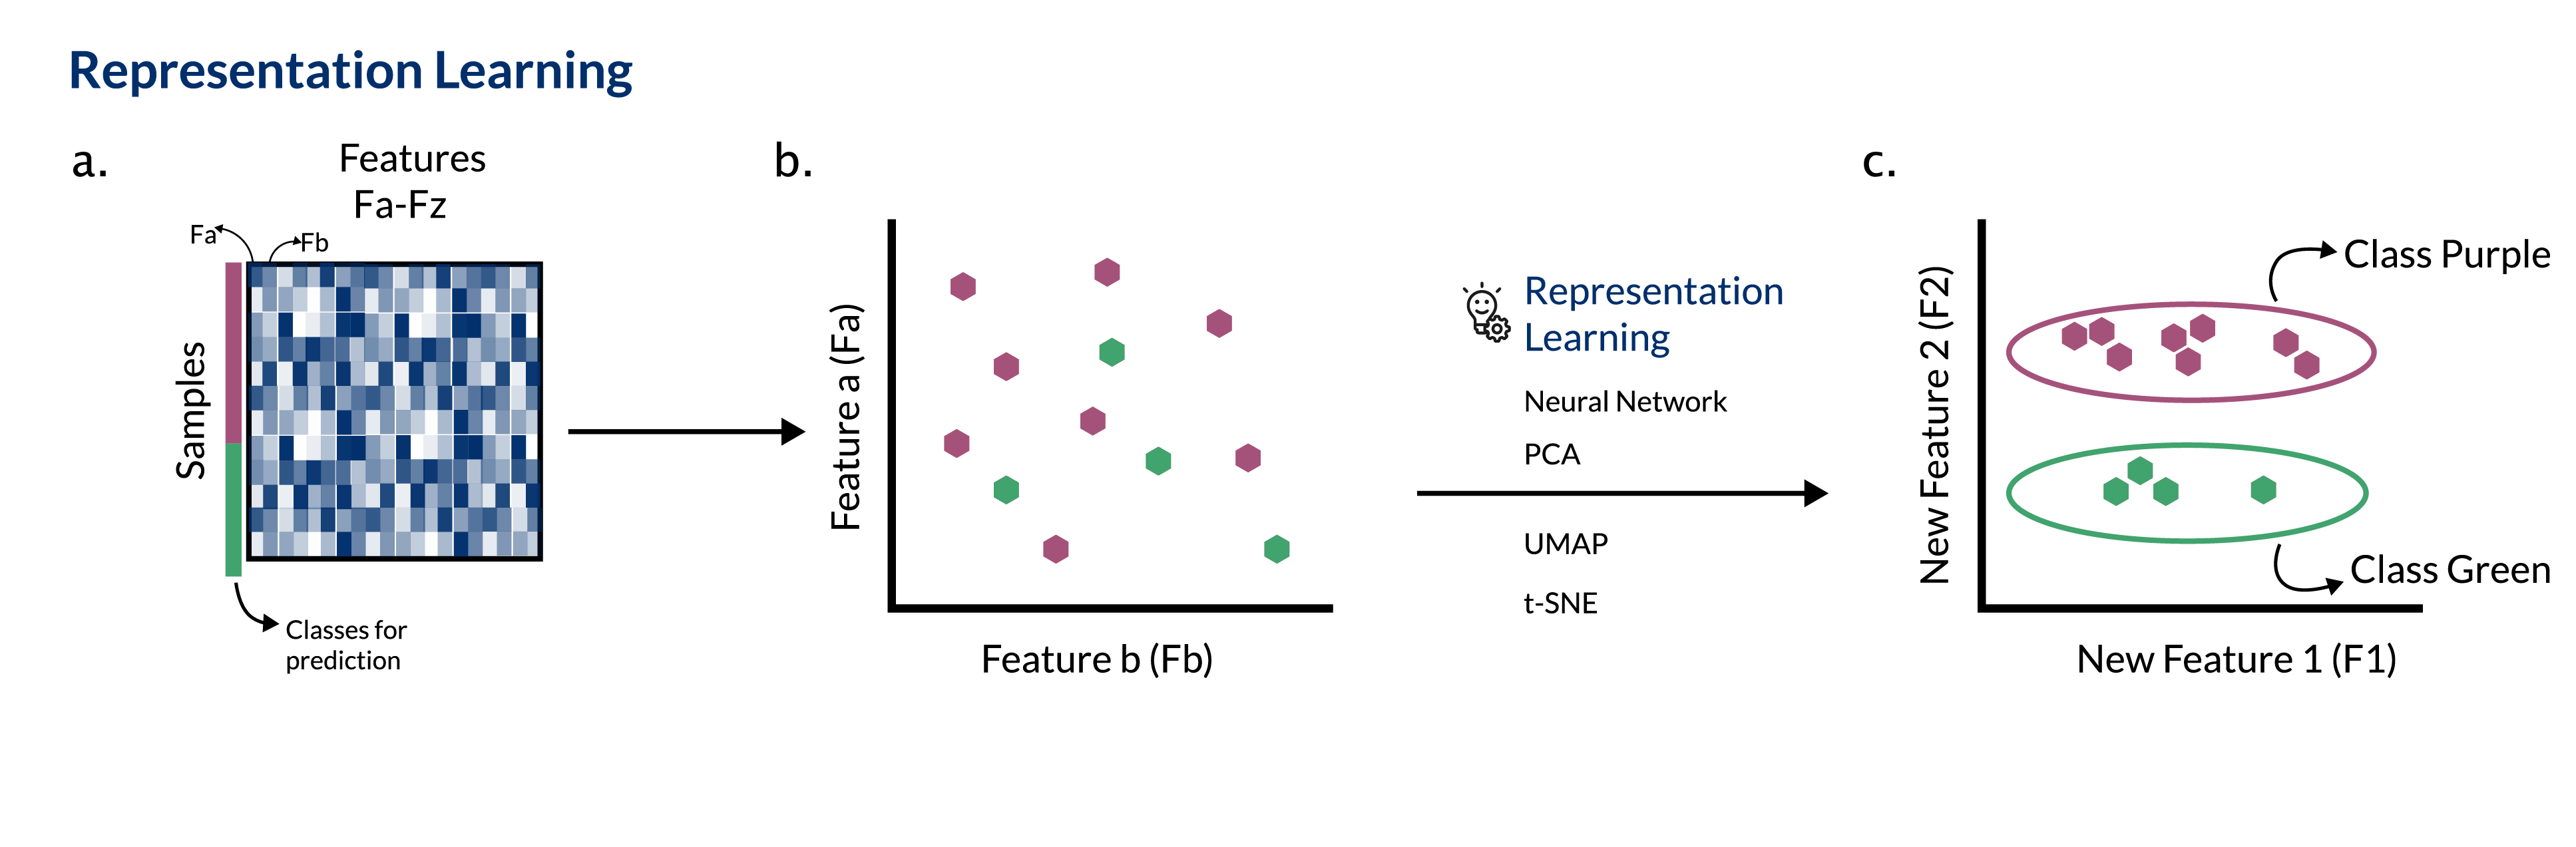
Figure 2: Representation learning can extract useful features from high dimensional data. a) The data (e.g., transcriptomic data) are highly dimensional, having thousands of features (displayed as Fa-Fz). Samples come from two separate classes (purple and green row annotation). b) In the original feature space, Fa and Fb do not separate the two classes (purple and green) well. c) A representation learning approach learns new features (e.g., New Feature 1, a combination of Fa, Fb …. Fz, and New Feature 2, a different combination of Fa, Fb …. Fz). New Feature 2 distinguishes class, whereas New Feature 1 may capture some other variable such as batch (not represented). New features from the model can be used to interrogate the biology of the input samples, develop classification models, or use other analytical techniques that would have been more difficult with the original dataset dimensions.
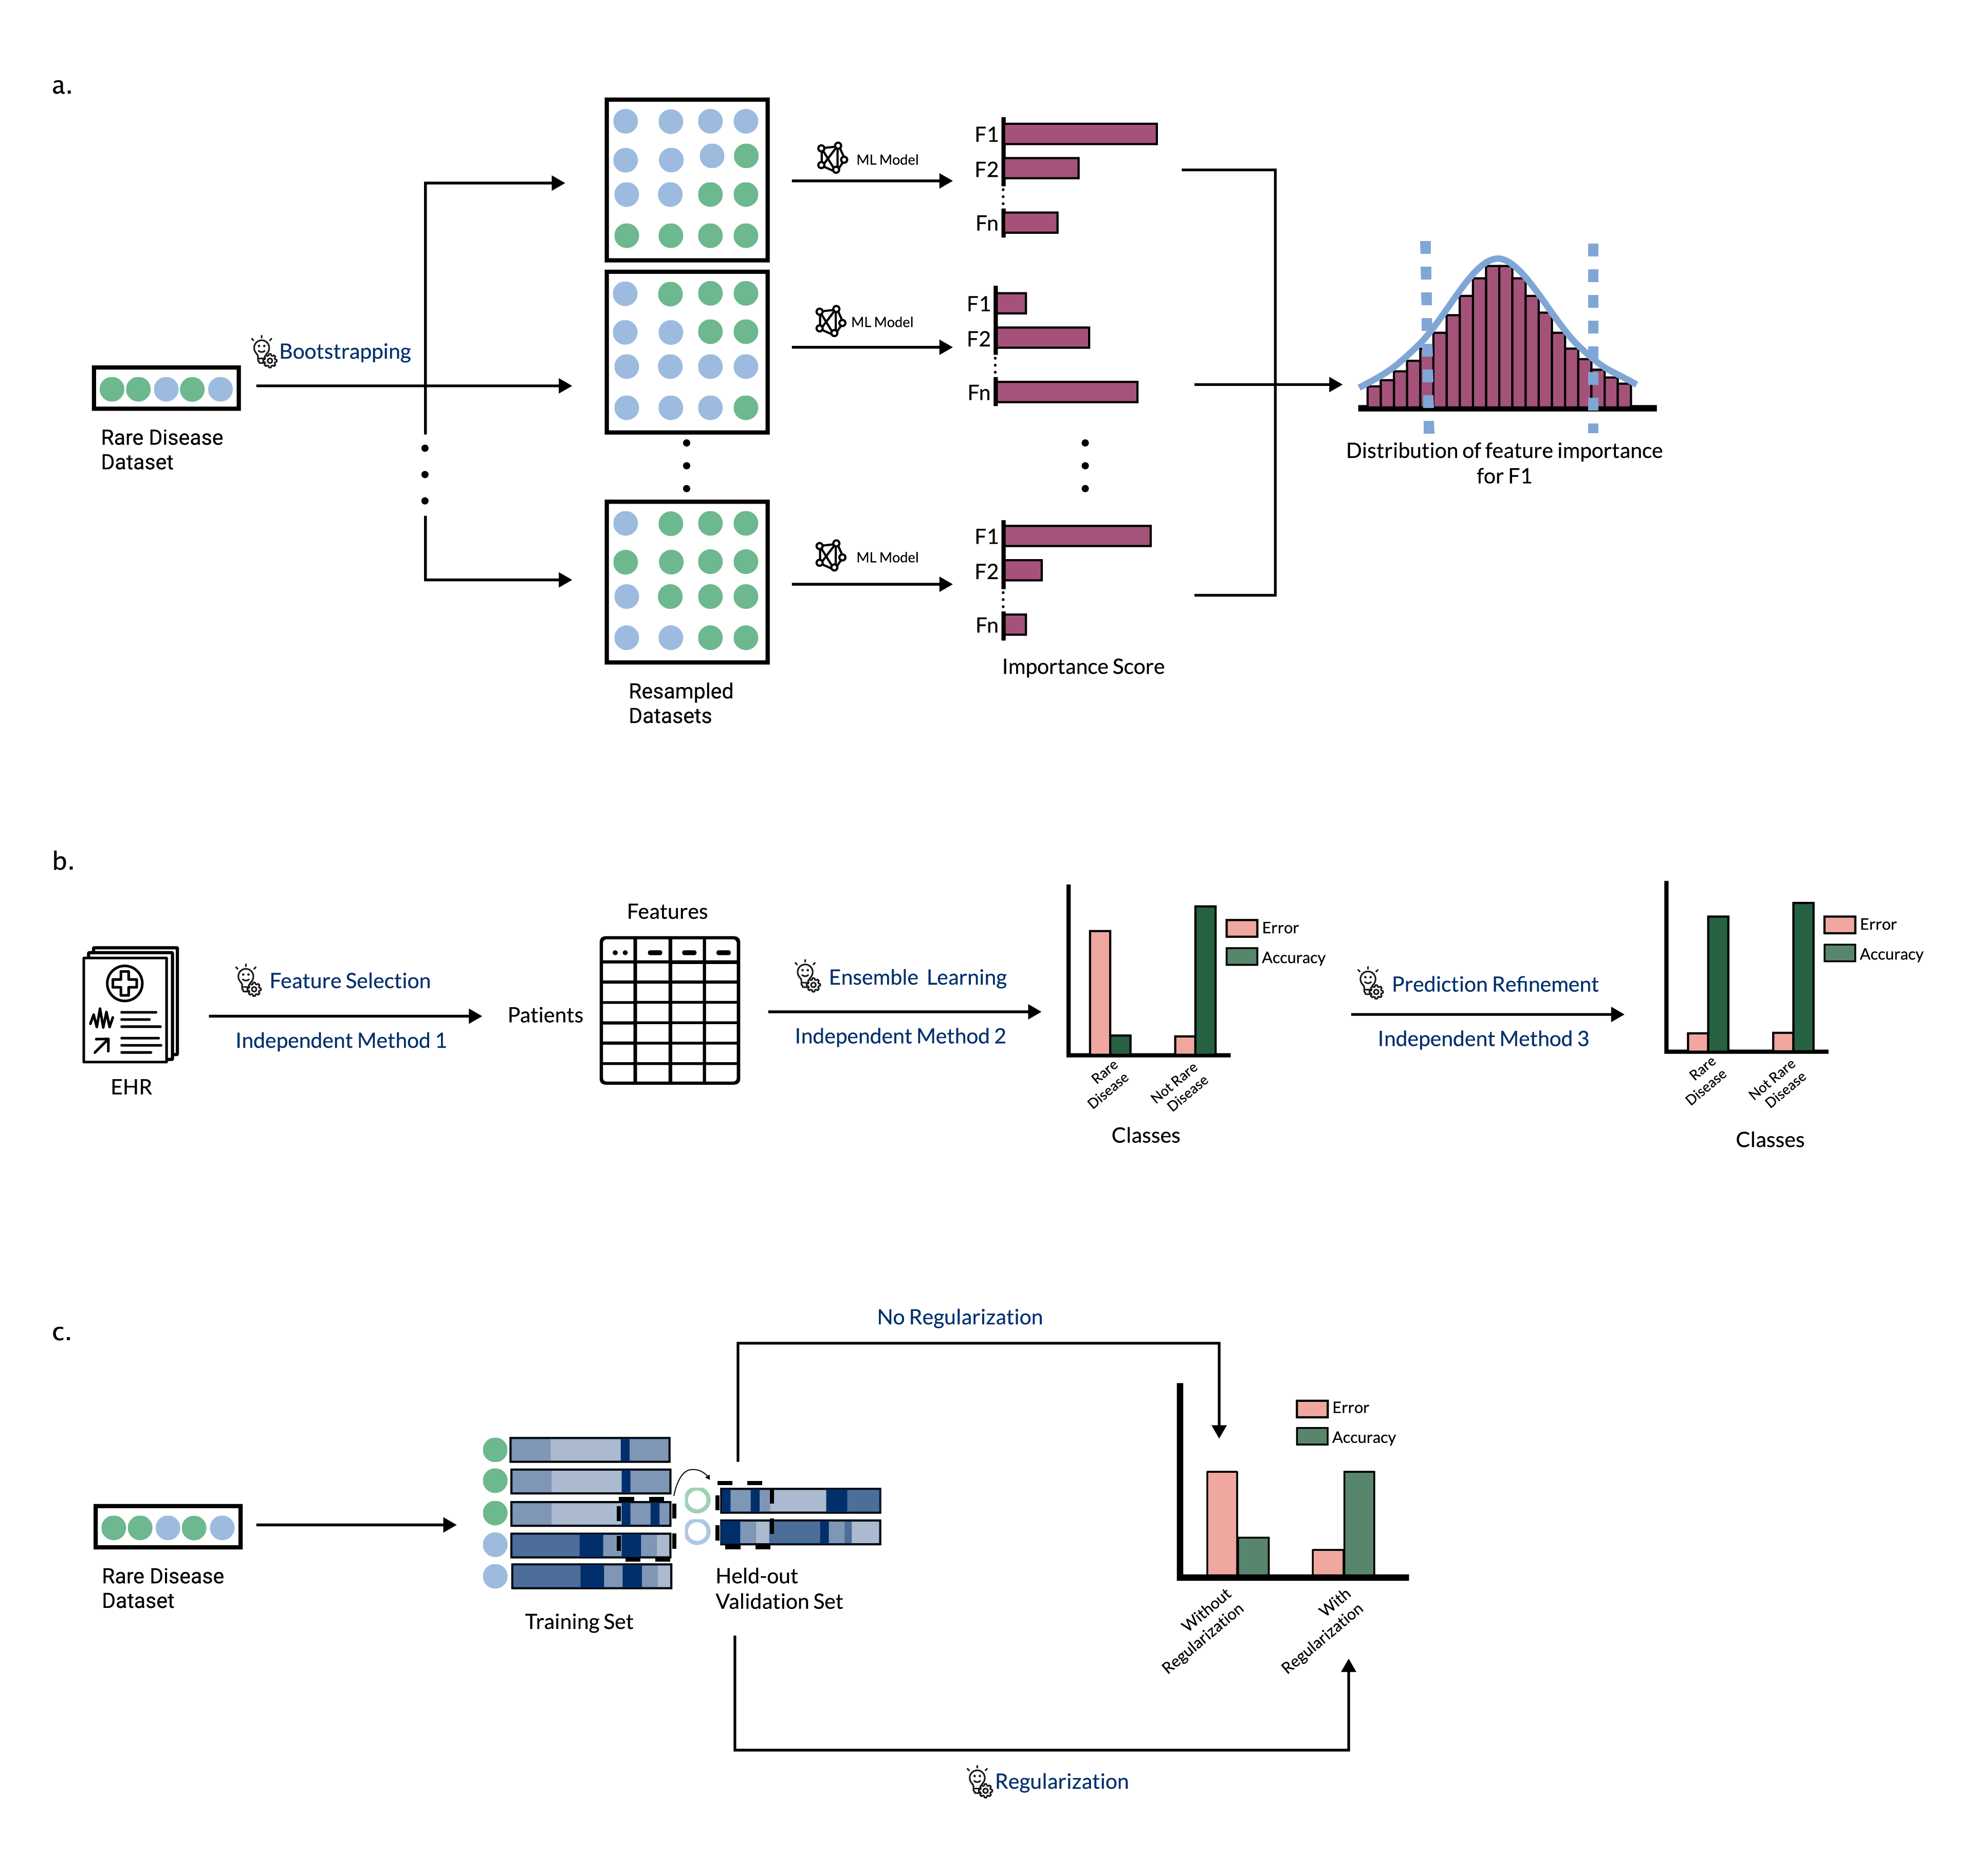
Figure 3: Strategies to reduce misinterpretation of machine learning model output in rare disease. a) Bootstrapping: Left panel shows a small rare disease dataset, which can be resampled with replacement using bootstrap to form a large resampled dataset (middle panel). Running the same ML model on multiple resampled datasets generates a distribution of values for the importance scores for each feature utilized by the ML model (right panel), b) Cascade Learning: A schematic showing the different steps in a cascade learning approach for identifying rare disease patients from electronic health record data. The bar plot in the middle panel schematically represents patient classification accuracy after ensemble learning. The accuracy is high for non-rare diseases, but low for rare diseases. The bar plot on the right panel depicts classification accuracy after implementation of cascade learning. The accuracy is high for both non-rare and rare diseases. c) Regularization: A schematic showing the concept of regularization to selectively learn relevant features. The samples (green and blue circles) in the rare disease dataset on left panel can be represented as a combination of features. Each horizontal bar in the middle panel (training set) represents a feature-by-sample heatmap for one sample each. In the held-out validation dataset, for a sample of unknown class (open circle), some features recapitulate the pattern present in the training set, while others do not. The right panel depicts accuracy of predicting the class of the open circles with or without using regularization during implementation of the ML models on rare disease data. Without regularization the classification accuracy is low due to presence of only a subset of learned features (denoted by dashed rectangle in middle panel), but with regularization this subset of features is sufficient to gain high classification accuracy.
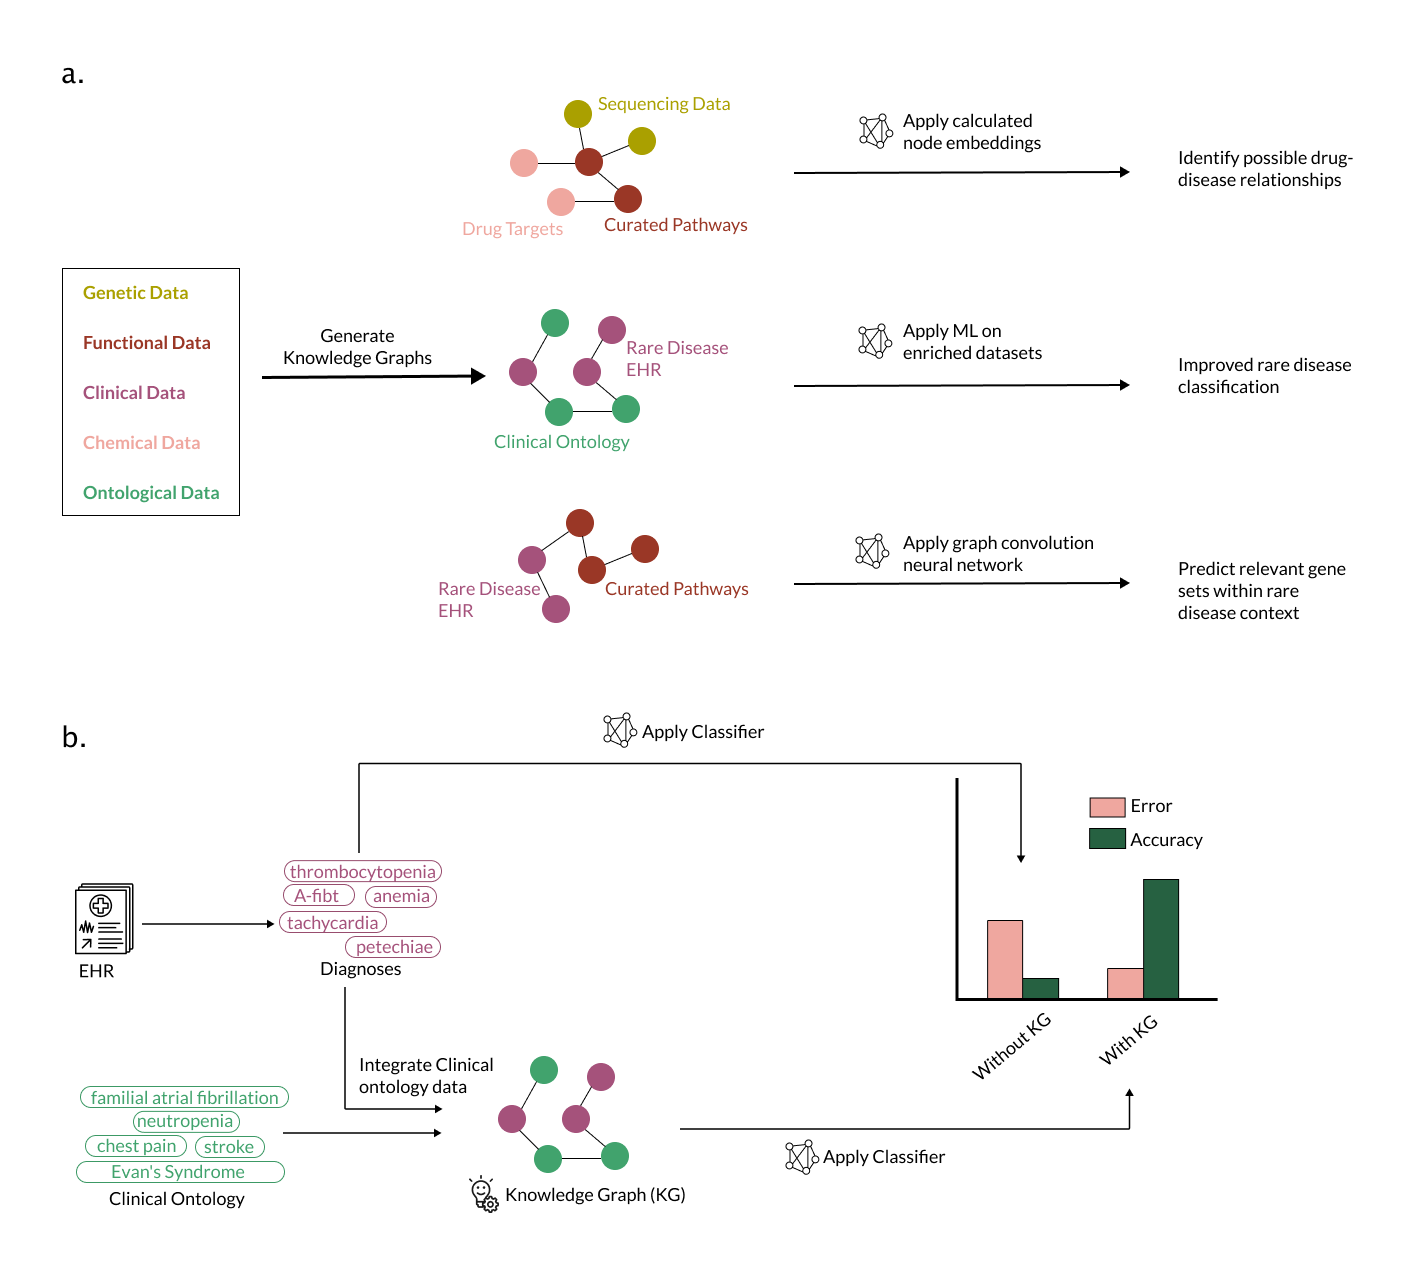
Figure 4: Application of knowledge graphs can improve machine learning in rare disease. a) Knowledge graphs integrate different data types (e.g., genetic, functional, clinical, chemical, and ontological data) and may allow models to learn from connections that are rare disease-specific or happen in many biomedical contexts. There are a variety of possible applications of this approach, including identifying new disease-drug relationships [62], augmenting data to improve accuracy of models trained on the data [63], or mining prior knowledge to discover important gene sets and pathways in rare diseases [64]. b) Knowledge graphs can also be used to augment data. Li et. al. [61] applied a classifier to an EHR corpus to identify rare disease patients. They trained a classifier on the EHR data alone (e.g., thrombocytopenia, anemia) and trained another classifier on data augmented with medically-related concepts from a knowledge graph (e.g., neutropenia, stroke). The classifier trained on knowledge-graph augmented data has lower error and higher accuracy (right panel).
Figure 5: Feature-representation-transfer approaches learn representations from a source domain and apply them to a target domain. a) Combination of features representing samples of a large dataset (transcriptomic data from tumors) are learned by an ML model through representation learning. b) When applied to a small cell line dataset, the representations extracted by an ML model tend to be incomplete and correlate poorly with clinical or drug sensitivity features. c) When a representation learning model trained on the large dataset (a) is applied to the small cell line dataset to extract consistent combinations of features based on the combinations found in the larger training dataset, the extracted representations correlate strongly with the clinical or drug sensitivity features
Figure 6: Combining multiple strategies strengthens the performance of ML models in rare disease. a) The authors of DeepProfile trained a variational autoencoder (VAE) to learn a representation from acute myeloid leukemia data without phenotype labels, transferred those representations to a small dataset with phenotype labels, and found that it improved prediction performance in a drug sensitivity prediction task [51]. b) The authors of MultiPLIER trained a Pathway-Level Information ExtractoR (PLIER) model on a large, heterogeneous collection of expression data (recount2 [87]) and transferred the representations (termed latent variables) to multiple datasets from rare diseases that were not in the training set [70]. Expression of PLIER latent variables can be used to check for concordance between datasets, among other applications.
Box 1: Common uses for machine learning in rare disease:
(a) Identifying patients with rare diseases
ML can be used to identify features in high dimensional data that correlate strongly with a patient or sample phenotype and subsequently predict the presence or absence of a rare disease.
For example, supervised ML models can be trained on electronic health records, genetic data, or medical images to identify potential new patients with a rare disease.
(b) Drug discovery or repurposing
ML can help identify potential drug candidates for rare diseases.
For example, unsupervised and supervised algorithms trained on genetic and molecular data from high throughput screens can identify novel therapeutic targets for a rare disease.
Additionally, algorithms utilizing knowledge graphs, genomic data, and databases of existing approved drugs can identify potential therapeutic candidates for rare diseases.
(c) Clinical trial design improvement
Optimized study design and identification of appropriate trial participants can greatly reduce costs while increasing the likelihood of successful outcomes for clinical trials.
ML approaches can benefit clinical trial study design.
For example, unsupervised ML approaches can be used to identify sub-groups of patients who are more likely to respond well to a particular treatment.
Supervised ML approaches can also be used to predict drug response in rare disease patients.
(d) Molecular subtyping of disease
Rare diseases often show overlapping and heterogenous phenotypes.
ML approaches can be used to identify molecular subtypes of the disease for better understanding.
For example, unsupervised ML approaches can help identify new subtypes of a rare disease using molecular and genetic data.
The same approaches can help identify the important molecular features that define the subtypes.
(e) Patient prognosis prediction
Rare diseases can suffer from lack of in-depth understanding of disease mechanism.
Biomarkers or clinical features that correlate strongly with adverse outcomes can be beneficial in predicting prognosis of a patient.
Supervised ML algorithms can be useful in identifying factors contributing to risk of adverse outcomes or progression to advanced disease in rare disease patients.
Patient stratification can help identify patient subpopulations who can benefit by early and aggressive interventions.
Box 2: Understanding experimental design of ML to inform requirements for data:
Components of ML experiments
ML algorithms identify patterns that explain or fit a given dataset.
Every ML algorithm goes through training, where it identifies underlying patterns in a given dataset to create a “trained” algorithm (a model), and testing, where the model applies the identified patterns to unseen data points.
Typically, a ML algorithm is provided with: 1. a training dataset , 2. an evaluation dataset , 3. a held-out validation dataset.
These input data can be images, text, numbers, or other types of data which are typically encoded as a numerical representation of the input data.
A training dataset is used by the model to learn underlying patterns from the features present in the data of interest.
An evaluation dataset is a small and previously unused dataset which is used during the training phase to help the model iteratively update its parameters (i.e., hyperparameter tuning or model tuning).
In many cases, a large training set may be subdivided to form a smaller training dataset and the evaluation dataset, both of which are used to train the model.
In the testing phase, a completely new or unseen test dataset or held-out validation set is used to test whether the patterns learned by the model hold true in new data (i.e., they are generalizable).
While the evaluation dataset helps us refine a model’s fit to patterns in the training data, the held-out validation set helps us test the generalizability of the model.
If a model is generalizable, it is able to make accurate predictions on new data.
High generalizability of a model on previously unseen data suggests that the model has identified important patterns in the data that are not unique to the data used for training and tuning.
Generalizability can be affected if data leakage occurs during training of the model, i.e., if a model is exposed to the same or related data points in both the training set and the held-out validation set.
Ensuring absence of any overlap or relatedness among data points or samples used in the training set and evaluation set is important to avoid data leakage during model training.
Specifically, in cases of rare genetic diseases where, for example, many samples can contain familial relationships or data from the same patient could be collected by multiple specialists at different clinical facilities, special care should be taken while crafting the training and testing sets to ensure that no data leakage occur and the trained model has high generalizability.
Training and testing
The implementation of a ML experiment begins with splitting a single dataset of interest such that a large proportion of the data is used for training, and the remaining data is used for testing or validation as the held-out validation dataset.
The training dataset is generally subdivided into the training dataset and the evaluation dataset.
Ideally, a held-out validation dataset is an entirely new study or cohort, as researchers typically aim to build models that generalize to unseen, newly generated data.
In rare diseases where multiple datasets may be combined to make a large enough training dataset, special care should be taken to standardize the features and the patterns therein.
Although ML algorithms generally expect that datasets have uniform features, normalizing training and testing data together may introduce similarities between samples (causing inadvertent data leakage) that hamper the goal of training models that are highly generalizable.
The iterative training phase helps the model learn important patterns in the training dataset and then use the evaluation dataset to test for errors in prediction and update its learning parameters (hyperparameter tuning).
The method by which the trained model is applied to the evaluation dataset to measure performance and update the hyperparameters is called cross-validation.
There are multiple approaches that can be deployed to maximally utilize the available data when generating training and evaluation datasets e.g., leave-p-out cross-validation, leave-one-out cross-validation, k-fold cross-validation, Monte-Carlo random subsampling cross-validation.[88]
In the case of k-fold cross-validation, a given dataset is shuffled randomly and split into k parts.
One of the k parts is reserved as the evaluation dataset and the rest are combined and used as the training dataset.
In the next iteration, a different part is used as the evaluation dataset, while the rest are used for training.
To avoid data leakage, and to promote generalization of models to new studies, researchers can use study-wise cross-validation, such that all samples from a study are in the same fold and no individual study is represented in both the training and evaluation datasets.
Once the model has iterated through all k parts of the training and evaluation datasets, it is ready to be tested on the held-out validation dataset.(Figure [1]b)
The held-out validation dataset is exposed to the model only once to estimate the accuracy of the model.
High accuracy of a model during cross-validation but low accuracy on the held-out validation dataset is a sign that the model has become overfit to the training set and has low generalizability.
If there is evidence of overfitting, researchers should revisit the construction of the dataset to make sure they meet the best practices outlined above.
It is important to note that accuracy alone may not be the best measure of performance in rare disease datasets.
A model tested for identifying rare disease samples may still achieve high accuracy if it identifies every sample as a non-rare disease sample.
Measures that are more suitable to handle class imbalance, such as the Kappa statistic or area under the precision-recall curve [89], are better metrics for model performance for rare disease.
Box 3: Definitions:
Knowledge Graph
A knowledge graph is a network representation of human knowledge about a domain, abstracted into nodes and edges.
Any entity of interest (for example a gene, a disease, a protein, or a cell-line) can be represented as a node in a knowledge graph.
All nodes can be linked through edges that represent known relationships between the nodes.
Edges can be directed, indicating that the order of the nodes is important for encoding the relationship, or undirected.
For example, a gene (node) can be linked to a protein (node) using a directed edge that represents the relationship that the protein is generated through the transcription and translation of the gene.
Knowledge graphs serve to integrate data that exist in distributed sources, encode human readable knowledge in machine readable format, and evolve in a flexible manner to integrate new knowledge as it becomes available.
Machine Learning
Machine learning is a scientific discipline at the intersection of computer science and statistics, which combines computational and statistical methods to identify patterns in sample data.[90]
In this discipline, one intends to use data as input and apply or fit predictive models to recognize patterns in the data or identify informative groups among the data using objective computational methods.
Rare Disease
According to the Orphan Drug Act[4] of United States of America, diseases or conditions that impact less than 200,000 people in the U.S are considered to be rare diseases.
The European Union defines a disease as rare when it affects less than 1 in 2,000 people.
Regularization
Regularization is an approach to reduce overfitting of models to training data, where a penalty or constraint is added to a model trained on a training dataset to avoid making large prediction errors on the evaluation dataset.
Transfer Learning
Transfer learning is an approach where a model trained for one task or domain (source domain) is applied to another, typically related task or domain (target domain), for example a model pre-trained natural images from the ImageNet dataset can potentially be used to classify medical images.[92]
Transfer learning can be supervised (one or both of the source and target domains have labels), or unsupervised (both domains are unlabeled).
Variational Autoencoder
Variational Autoencoders or VAEs are unsupervised neural networks that use hidden layers to learn or encode representations from available data while mapping the input data to the output data.
VAEs are distinct from other autoencoders since the distribution of the encodings are regularized such that they are close to a normal distribution, which may contribute to learning more biologically relevant signals [24].
Classification in the Presence of Label Noise: a Survey
Frénay and Verleysen (2014) define and describe sources of label noise, consequences of label noise on ML model development, and techniques that can help mitigate the resulting issues.
It also suggests few quality metrics that may be used to test newly developed models to understand their performance in presence of noisy data.
Breiman (2007) describes the theory underlying random forest algorithm which is a popular ML method with applications in almost every high-dimensional data field, including medicine and life sciences.
The paper also highlights the behavior of random forests in the presence of data where each individual feature is not strong enough to distinguish between classes (weak inputs).
This scenario is frequently encountered in biomedical data and especially rare disease data.
Deriving disease modules from the compressed transcriptional space embedded in a deep autoencoder
Dwivedi, et. al. (2020) apply representation learning to meaningfully group genes into modules in a data-driven manner.
The authors turned the deep neural network into a “glass-box” by layering knowledge-based interpretation on the gene modules identified using a variational autoencoder to provide insights into what each layer of their model represent.
Pathway-level information extractor (PLIER) for gene expression data
Mao and colleagues (2019) use the principles of representation learning combined with prior-knowledge to develop a model that capitalizes on correlated gene expression to identify meaningful biological pathways and reduce noise in data introduced due to technical variation.
This method has been the foundation of mutiple recent works applying ML on rare disease gene expression data.
Automatic detection of rare pathologies in fundus photographs using few-shot learning
Quellec, et. al. (2020) train a convolutional neural network (CNN) to identify rare pathologies in retinal images.
They used an approach called few-shot learning, in which the CNN is trained on a large cohort of retinal images and then trained on a very small number of examples of retinal images with rare pathologies.
A Literature-Based Knowledge Graph Embedding Method for Identifying Drug Repurposing: Opportunities in Rare Diseases
Sosa and colleages (2020) develop a knowledge graph of drug, disease, and gene relationships from pubished medical literature.
They then use a graph embedding method to explore the knowledge graph and predict drug repurposing opportunities.
 0000-0002-1775-3645
·
0000-0002-1775-3645
·  jaybee84
 allawayr